Introduction to Zabbix
What is Zabbix?
Zabbix is a general purpose, high performance and highly configurable network management platform. It can be used to monitor network devices as well as anything you can programmatically see on a network. This includes operating system internals, processes, services and anything else one can write a program or script for. Remote monitoring is also possible using a combination of internal functions and operator provided scripts. Many internal functions are available that make protocol specific testing simple.
This article assumes a basic familiarity of Network Management, but not necessarily of the details on how Zabbix or SNMP works. A few Zabbix examples will be provided at the end of this article but knowledge of Zabbix administration is not necessary to understand the basic concepts presented here. For engineers working on services (such as DNS or HTTP) or network infrastructure elements (switches, routers, firewalls, etc), it is the basics on how triggers are defined and used that is important and not the specific syntax of specifying one within Zabbix that is important. Together with the Zabbix implementation group proper sets of tests can be devised to best analyze and report anomalies in both internal and external networks and services.
Most of what we use in Zabbix relates to Items, Triggers and Actions. Items are the tests that the system makes. The results from these tests form the data which we can use for both real-time notifications as well as later analysis (including graphing) and long term retention. Triggers define boundary conditions for the Items (tests) which we are interested in. Triggers are stateful and exist in either a normal (OK) state, or PROBLEM state depending on if the condition expressed in the trigger has been satisfied or not. Actions are procedures that are invoked whenever a trigger changes state. Separate Actions are defined for state transitions OK -> PROBLEM and PROBLEM -> OK.
The actual syntax for specifying Items, Triggers, and Actions within Zabbix can get quite complicated. The good news though is that understanding at this level is not necessary in order to build the rules based framework for an effective management platform.
If you are interested in a more detailed technical description of Zabbix and how it can be used see Introduction To Zabbix in the Zabbix Version 2.2 Manual.
Monitoring Goals and Focus
Network Management platforms can be used for a wide variety of purposes. Some of the ways we use Zabbix include:
- Real-time Monitoring of Critical Services
- Reliability Monitoring
- Available Bandwidth Monitoring (remote)
- Service Availability
- Performance over time metrics (graphs)
- System Capacity / Performance Monitoring
The specification of Items (tests) and Triggers can be heavily influenced by how the data is to eventually be used. Tradeoffs come into play in determining the granularity of the data, trigger sensitivity and reporting methods. In general when looking for critical issues that need immediate action, larger analysis windows are used to ensure against false positives. When collecting data for use in determining service quality over time more sensitive triggers combined with lower priority message distribution methods (digests) and other non real-time analysis methods can be used. The frequency of testing is often application dependent with rules determined mainly by local needs.
Critical problems uncovered by the monitoring system are currently sent by email to the JADE-Critical distribution list (see Network Management Mailing Lists for more details on lists used for network management notifications). Most, if not all, of the subscribers to this list get notifications immediately upon submission. The intent for this list is for notification of issues that require IMMEDIATE attention. For this reason it is important that the ONLY messages that get sent via this channel are indeed critical in nature.
When we first started our remote monitoring, all notifications were sent to JADE-Critical. The initial Targets and Actions were very sensitive to small changes in network performance and accessibility sometimes resulting in excess of 200 messages a day being sent out. With such a high message load it is almost impossible to pull out issues that require immediate action as the signal to noise ratio was simply too low.
The Targets and Action configurations were modified in January, 2014 to reduce trigger sensitivity and to direct all notifications to the JADE-Warning list instead. Subscribers to JADE-Warning get message digests once a day instead of immediate delivery of each message. The daily digest is easy to go through and get a high level view of the network stability. Additional tests were configured with corresponding triggers with longer analysis windows to drive the traffic to JADE-Critical. The results so far have been promising with Critical notifications being significantly reduced.
What Can I Monitor?
If you can see a device, process, or service on the network through a program, protocol, or script you can monitor it using Zabbix. Traditional Network Management platforms use SNMP (Simple Network Management Protocol) to monitor network devices. Zabbix has full support for monitoring any SNMP capable device but is not limited to just the use of SNMP.
Zabbix is made up of two main components – Zabbix Servers and Zabbix Agents (this is a simplification as complex configurations can be built also employing proxies but is outside the scope of this paper). Zabbix Servers are central processes that monitor, interact with Zabbix proxies and agents, calculate triggers, send notifications and act as a central repository of monitored data. The functioning of a basic Zabbix server is broken into three distinct components – the Zabbix server (monitoring process), web frontend and database storage. Zabbix servers can run on most Unix like operating systems.
A Zabbix Agent is a process deployed on monitored targets to actively monitor local resources and applications (hard drives, memory, processor statistics, etc). The agent gathers operational information locally and reports data to a Zabbix server for further processing. Zabbix agents are extremely efficient due to use of native system calls for gathering statistical information and can run on most Unix like and Windows operating systems.
Zabbix Agents support a wide range of built-in functions that can easily be referenced in Item (test) specifications. A list of these for Version 2.2 can be found on the Zabbix Agent manual page. Agent functionality can be extended through the use of UserParameters. These are hooks to programs or scripts written for site specific monitoring needs. The combination of the built-in tests and user provided functions (via UserParameters) allow Zabbix to be used as a monitoring platform for almost any kind of application.
Item and Trigger Design
Items are the configurable tests that Zabbix runs to collect monitoring data. They are highly configurable in terms of query types, methods, and how frequently they are run. Data is stored on a backend database system with retention time configurable on an item by item basis. The Zabbix server schedules tests to be run based on the Item configuration and records the results. Aside from performing the tests and recording the results, the Item processing does not perform any additional tasks. Items exist to collect simple test data results only.
Triggers on the other hand monitor the results of the tests that are configured in the Item definitions. Trigger expressions define the threshold of what state data is considered “acceptable”. Should incoming data surpass the acceptable (OK) state, a trigger is “fired” and the trigger changes state to PROBLEM. Aside from the monitoring of Item results and performing analysis of the returned data (sometimes over a range of results or time and not just a single test) the main function of triggers is to make note of test data changes to a state which is considered unacceptable (and back). No additional processing or actions are performed by triggers.
Actions are the final piece of the puzzle. They are responsible for taking some pre-configured action on trigger state changes. Actions can be configured to act on the change of state of many variables in the system, but are most often tied to trigger state transitions (OK <–> PROBLEM). They can be configured to be most anything the administrator wants as it is simple to connect actions to custom written scripts or programs. Often the action is to send email or SMS notifications to those able to resolve problems, but they can also be configured to perform automated remedial actions.
Item Definitions
Zabbix Items define tests that need to be performed. These tests are usually simple tests that return either a single true/false value (boolean) or range of values. One test is performed per test run. An example Item definition for testing a remote DNS server is shown below:
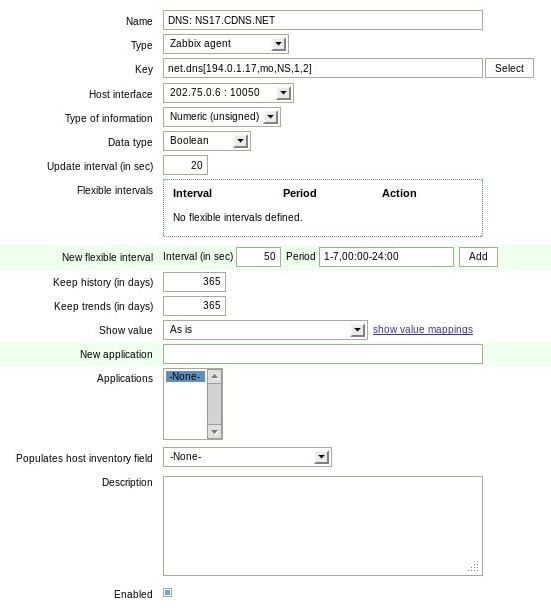
This configuration provides an Item name (DNS: NS17.CDNS.NET) that can be referenced by other parts of Zabbix. It communicates with a Zabbix agent listening on port 10050, IP address 202.75.0.6 and returns a Boolean (true or false) return value. The test is run once every 20 seconds with a data retention period of one year (365 days).
The test to be run is specified in the Key field. In this case the Zabbix Agent checks to see if the remote DNS server is responding by sending a request to 194.0.1.17 asking for the NS record for the mo zone. The timeout for the operation is set to one second with a retry count of two.
This simple example uses the built-in key type net.dns. Other built-in key types are also available. Many other Item types can be configured using a combination of other keys, user defined functions, or other Query types (SNMP, internal, external, IPMI, SSH, telnet, etc).
Trigger Definitions
If the purpose for an Item is to only record data for later analysis with no associated run-time actions then trigger and action configurations are not required. We run many of these on the Jade network where a variety of operational data is collected and later analyzed through the use of the Zabbix graphing functions. These include things like temperatures, network bandwidth usage, fan speed and other.
If tests are run with the intention of detecting and reacting to anomalies, triggers and action definitions are needed. Triggers can be either state-aware or non-state-aware. The majority of the Zabbix documents reference non-state-aware triggers. These are triggers that determine if the data is acceptable or not independent of the internal state (OK/PROBLEM) of the trigger. State-aware triggers take into consideration the internal state of the trigger in determining if the data is acceptable or not and if a state transition should occur. An example of a non-state-aware trigger is shown for the previous DNS Item check:
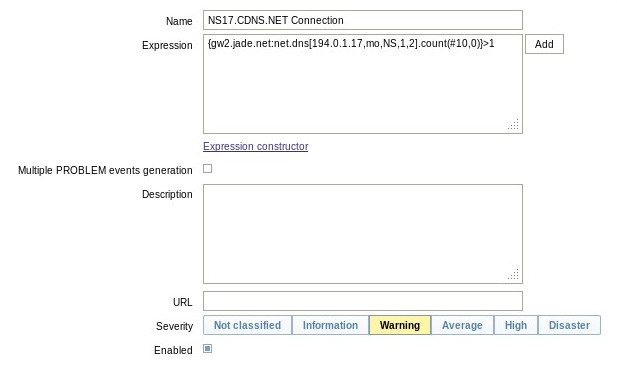
The Name field allows us to label this particular trigger. The Expression section references the Item definition and further indicates that the trigger will fire (transition to a PROBLEM state) if two or more failures are detected within the last 10 samples. As the Item is defined to run once each 20 seconds, this trigger specifies a 200 second wide window and a 20% failure rate. As only two failures are needed, the trigger can fire in as little as 40 seconds. This kind of test is very useful for long term monitoring of the connection quality as the sensitivity is high. In our case as we have 7-way failover on the nameservers a short outage period is not necessarily critical. For this case we have a corresponding action definition that sends notifications out to a mailing list configured to only send out single daily digest messages. By reviewing the single digest message and/or the system graphs setup to monitor this Item, connection quality over time can easily be observed while not overloading administrators.
Another configuration which was used utilized the same Item tests, but had different trigger metrics. Instead of using a relatively small window and firing at a 20% failure rate, the window size was 10 minutes with a configured failure rate of 80%. Simple changes to the Expression was all that was necessary with the count function being rewritten to:
…count(#30,0)}>23
This says to look at the last 30 samples (10 minutes of data using a 20 second interval). If more than 23 errors (24 or more) are detected in this period we signal a transition to PROBLEM state. The combination of a larger test window while requiring 80% or more failure rate results in far fewer initial trigger transitions. This more accurately reflects what we might consider a critical condition given our failover setup. We however loose the finer grained view of failures that could be more useful in detecting service quality problems. Fortunately we still have the ability to independently graph the Item data regardless of trigger configurations. In our case we have different action definitions for the two configurations above with the later resulting in higher priority message notifications being generated.
Trigger Flapping / Hysteresis Controls
Please accept my apologies for the techie heading for this section. If you want to look for additional references to the material below the above title can be used for searches. With that out of the way let’s dig into the issues using what hopefully will be down to earth and easy to understand language.
The last change in the example above created a trigger with a 10-minute window looking for an 80% failure rate. It is not state-aware and uses the same metrics to determine transition from an OK state to PROBLEM as it does to dismiss the PROBLEM state. For some tests this may be ok, but for issues that involve intermittent or network dependent problems that are not static in nature this can cause excessive triggering and operator notifications. If we are doing this over a channel for signaling problems that require immediate action, this decrease in signal to noise ratio reduces the organization’s ability to react properly.
So why would this kind of a configuration result in excessive triggers? Consider a problem situation where the failure rate is variable – say 80% plus or minus 10%. This means that when problems start to occur the error rate can fluctuate between 70% and 90%. With our existing trigger the initial buildup for the first trigger will wait until at least 8 minutes after the start of the problem before firing. After that however should a short window with no problems happen, the trigger will fall back into an OK state. The potential oscillation back and forth above and below the 80% failure rate causes what is called trigger flapping. As a result many operator notifications and/or other actions will be generated for a single extended problem.
The solution is to define different algorithms for entering a PROBLEM state from that used to exit the PROBLEM state (what the Zabbix documents calls hysteresis control). Other than the specification of two algorithms rather than one, the trigger expression is straigforward. Zabbix provides the macro {TRIGGER.VALUE} that can be queried within a trigger expression. When {TRIGGER.VALUE} is 0, the trigger is in the OK state. When {TRIGGER.VALUE} is 1, the trigger is in the PROBLEM state. Modification of the non-state-aware to a state-aware trigger can be done as simply as:
({TRIGGER.VALUE}=0 & expression1) | ({TRIGGER.VALUE}=1 & expression2)
Expression 1 is our original test for an 80% failure rate over 10 minutes. Expression 2 is the new test we make while in the PROBLEM state. For our example above, we change the algorithm for leaving the PROBLEM state to only happen if we get less than 10% failures over a ten minute period. The modified expression becomes:
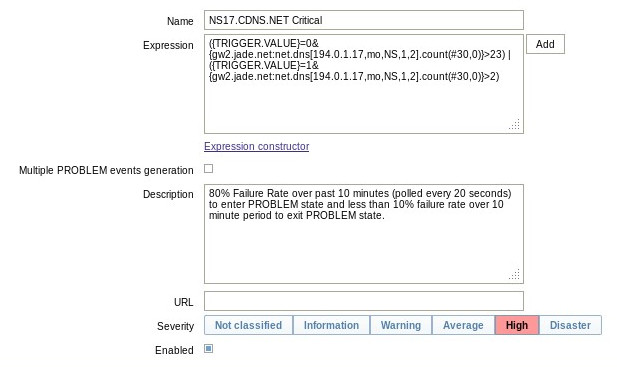
For additional information on Zabbix see below. See also Monitoring Rules Framework for how we design monitoring rules.
References
- Zabbix Overview – www.zabbix.com
- Zabbix Community Portal – www.zabbix.com
- Zabbix Manuals – www.zabbix.com
- Trigger Configuration – Zabbix 2.2 User Manual – www.zabbix.com
- Trigger Dependencies – Zabbix 2.2 User Manual – www.zabbix.com
- Zabbix Macros – Zabbix 2.2 User Manual – www.zabbix.com
- No more flapping. Define triggers the smart way – Zabbix Weblog – blog.zabbix.com
- Zabbix triggers with "flap-detection" and a grace period – meint.nl
- Zabbix Series 3: Trigger Anti Flap and Cascading failures – vpsboard.com